An Introduction to db2mon
Updated March 2025.
This original version of this article previously appeared in the IDUG Blog.
The need for db2mon
When monitoring table functions became the recommended way to view Db2 monitoring statistics back in Db2 version 9.7, we needed a simple way to collect and consume all that rich monitoring data. Being able to use SQL to query and analyze the monitoring data is great but most of the metrics are cumulative since database activation. This means in order to get a view of metrics for a certain time period (for example, the last hour) you need to take before and after samples and then compute the delta to see what database activity was happening during that interval.
We created db2mon to not only perform these delta calculations but also to produce insightful reports from the monitoring data. These reports help to more easily understand what the system is doing and what the top bottlenecks are. The MONREPORT.DBSUMMARY procedure is similar but only contains a tiny fraction of the information provided by the db2mon reports.
Use cases
The db2mon reports are focused around performance analysis and tuning.
Some of the reasons you would want to use db2mon include:
- Understand the workload and environment
- Application-level details like read/write ratio, types of statements and number of connections
- Db2 specific details like topology, what registry variables are set, dbm cfg and db cfg
- System level details like OS type, number of CPUs and available memory
- Find system bottlenecks
- Find opportunities to tune the system (for example, during a health check)
- As part of your database monitoring infrastructure
- During some of your critical batch jobs to get a better understanding of what is happening inside the engine
- At regular intervals around the clock (as some Db2 customers currently do) such as 10 minute monitoring intervals
- This will give you some data to refer to if something happens and further investigation is required (for example, performance started to suffer around 8pm last night)
- This will also help identify "What changed?" between two dates by comparing before and after db2mon data
How it works
db2mon can be run in either online or offline mode.
For details on how to actually run db2mon please refer to the Db2 documentation here.
Online mode
In online mode, you tell db2mon how long you would like to monitor the system for (for example, 60 seconds, 10 minutes, etc.) and after that duration, db2mon will produce a report of various database metrics collected during the monitoring interval. In online mode, db2mon makes use of DECLARE GLOBAL TEMPORARY TABLES (DGTTs) to store the metrics at the start and end of the monitoring interval and then produces another set of DGTTs to store the delta. The SQL queries to generate the reports provided by db2mon are then run on the delta DGTTs to produce the final report. We call it “online” mode because the report is created “live” on the system being monitored.
Offline mode
As in online mode, you tell db2mon how long you would like to monitor the system for. At that point db2mon will export as IXF the metrics from the start and end of the monitoring interval. These IXF files must then be copied to another system running Db2 (for example a test or dev environment). On this other system you would then run the appropriate db2mon scripts to import the data and generate the report.
Online vs. offline mode
As you can see offline mode would have less impact on the system being monitored since none of the delta computations or SQL queries to generate the report are run on the system being monitored. Online mode is certainly more convenient and in practice the overhead of running db2mon in online mode is typically negligible. To further ensure minimal impact to the system during online mode, we create a separate bufferpool for db2mon and we run all the SQL to populate the DGTTs with auto-commit disabled.
Design
When creating db2mon we had the following goals in mind:
- Lightweight – cannot impact performance of system being monitored
- Clean – do not create objects or otherwise pollute the system being monitored
- Backward compatibility – work with all supported versions of Db2
- Flexible – easily modifiable (such as adding new reporting queries)
Requirements
- All versions of Db2 LUW are supported starting from Db2 version 9.7
- A user temporary tablespace is required for creating the DGTTs in online mode
- If using db2mon.sh a user temporary tablespace will be created for you
- The following database monitoring switches must be set to either BASE or EXTENDED
- MON_REQ_METRICS
- MON_ACT_METRICS
- MON_OBJ_METRICS
List of reports – Lots of data!
The following is the list of reports included in db2mon at the current time. More reports are added to db2mon as need arises or as new monitoring metrics are added to Db2.
The reports are organized into groups that correspond to either the granularity of the monitoring metrics (for example database, statement or connection level metrics) or to a specific database object or function (for example bufferpools, tables, table spaces, sequences, latching and logging).
Point in Time (SQL, Lock waits, Utilities)
START#EXSQL: Currently executing SQL at start of capture (non-zero metrics only)
START#LOCKW: Current lock waits at start of capture
START#EXUTL: Currently executing utilities at start of capture
END#EXSQL: Currently executing SQL at end of capture (non-zero metrics only)
END#LOCKW: Current lock waits at end of capture
END#EXUTL: Currently executing utilities at end of capture
Database Level
DB#THRUP: Throughput metrics at database level
DB#CLACT: Client activity (active connections have at least 1 stmt/s)
DB#TIMEB: Time breakdown at database level (wait + processing)
DB#WAITT: Wait times at database level
DB#PROCT: Processing times at database level
DB#SORT: Sort metrics at database level
Statement Level
SQL#TOPEXECT: Top SQL statements by execution time
SQL#TOPEXECP: Top SQL statements by execution time, aggregated by PLANID
PKG#EXECT: Time spent executing by package
SQL#TOPWAITT: Wait time breakdown for top SQL statements by execution time
SQL#TOPWAITW: Top SQL statements by time spent waiting
SQL#TOPIOSTA: IO statistics per stmt - top statements by execution time
SQL#TOPROWS: Row level statistics per stmt - top statements by execution time
SQL#TOPSORT: Sort statistics per stmt - top statements by execution time
INF#EXPLN: Statement & plan identifiers - top statements by execution time
System Level (OS, CPUs, Memory)
DB#SYSRE: Database system resource usage information
Logging
DB#LOGWR: Database log write times
DB#LOGRE: Database log read times
DB#LOGST: Other database log statistics
Tablespace I/O
TSP#DSKIO: Disk read and write I/O times
TSP#DSKIOSYNC: Disk read and write I/O times (synchronous)
TSP#DSKIOASYNC: Disk read and write I/O times (asynchronous)
External Tables
DB#EXTBM: External table metrics
Latches
LTC#WAITT: Latch wait metrics
Deadlocks
DB#DLCKS: Deadlocks, lock timeouts and lock escalations
Table Statistics
TBL#ROWMC: Various table level metrics
TBL#DATSH: Data sharing metrics
Tablespace Statistics
DB#SIZE: Size of database
TSP#SIZE: Tablespace properties
TSP#USAGE: Tablespace usage over monitoring interval
BPL#STATS: Bufferpool statistics by tablespace
TSP#PRFST: Tablespace prefetching statistics
TSP#BPMAP: Tablespace to bufferpool mapping
Bufferpool Statistics
BPL#SIZES: Bufferpool sizes
BPL#HITRA: Bufferpool data and index hit ratios
BPL#READS: Bufferpool read statistics (overall)
BPL#RDSYNC: Bufferpool read statistics (synchronous reads)
BPL#RDASYNC: Bufferpool read statistics (asynchronous reads)
BPL#WRITE: Bufferpool write statistics (overall)
BPL#WRSYNC: Bufferpool write statistics (synchronous writes)
BPL#WRASYNC: Bufferpool write statistics (asynchronous writes)
Connection Level
CON#WAITT: Wait times at connection level
CON#STATS: Various metrics at connection level
CON#PAGRW: Physical and logical page reads and writes at connection level
Workload Balancing
WLB#SLIST: Workload balancing server list
Configuration (DB, DBM, Regsitry Variables)
CFG#REGVA: DB2 registry variable settings
CFG#DB: Database configuration settings
CFG#DBM: Database manager configuration settings
INS#INFO: Instance information
Database Memory Usage
DB#MEMST: Database memory set information @ end
DB#MEMPL: Memory pool information @ end
Sequences
DB#SEQIN: Sequences information
Db2 pureScale
CF#GBPIO: Group bufferpool IO statistics by tablespace
CF#GBPHR: Group bufferpool data and index hit ratios
CF#GBPIV: Group bufferpool invalid page statistics
CF#GBPDP: Tablespace data page prefetching statistics for group bufferpool
CF#GBPIP: Tablespace index page prefetching statistics for group bufferpool
CF#GBPFL: Count of group bufferpool full conditions
PAG#RCM: Page reclaim metrics for index and data pages
PAG#RCSMP: Page reclaim metrics for SMP pages
CF#RTTIM: Round-trip CF command execution counts and average response times
CF#CMDCT: Aggregate CF command execution counts
CF#CMDTM: CF-side command execution counts and average response times
CF#CMDTO: CF-side total command execution counts
CF#SYSRE: CF system resource information
CF#SIZE: CF structure size information
BLU: PAE/Distincts
BLU#PAGDI: Partial early aggregation / distincts
As you can see there are a lot of reports that make up the full db2mon report. Some reports are more useful than others depending on your workload and instance type.
There are however some reports that should be treated as “must read” for anyone using db2mon. The list of must-read reports:
- Database Throughput (DB#THRUP)
- Client Activity (DB#CLACT)
- Database Time Breakdown (DB#TIMEB)
- Database Wait Time Breakdown (DB#WAITT)
- Top SQL Statements by Execution Time (SQL#TOPEXECT)
- Top SQL Statements by Execution Time Wait Time Breakdown (SQL#TOPWAITT)
We will see examples of each of these reports in the next sections and you will get a feel for why they are so useful.
Database Throughput (DB#THRUP)
As the name suggests, this report provides various throughput metrics from the database level. The metrics included are:
- Activities per second (ACT_PER_S)
- Commits per second (CMT_PER_S)
- Rollbacks per second (RB_PER_S)
- Deadlocks per second (DDLCK_PER_S)
- Selects statements per second (SEL_P_S)
- Update, insert and delete statements per second (UID_P_S)
- Rows inserted per second (ROWS_INS_P_S)
- Rows updated per second (ROWS_UPD_P_S)
- Rows returned per second (ROWS_RET_P_S)
- Rows modified per second (ROWS_MOD_P_S)
- Package cache inserts per second (PKG_CACHE_INS_P_S)
- Physical disk reads per second (P_RD_PER_S)
The following is a sample of this report along with some callouts highlighting some of the useful insights you can draw from the metrics provided.
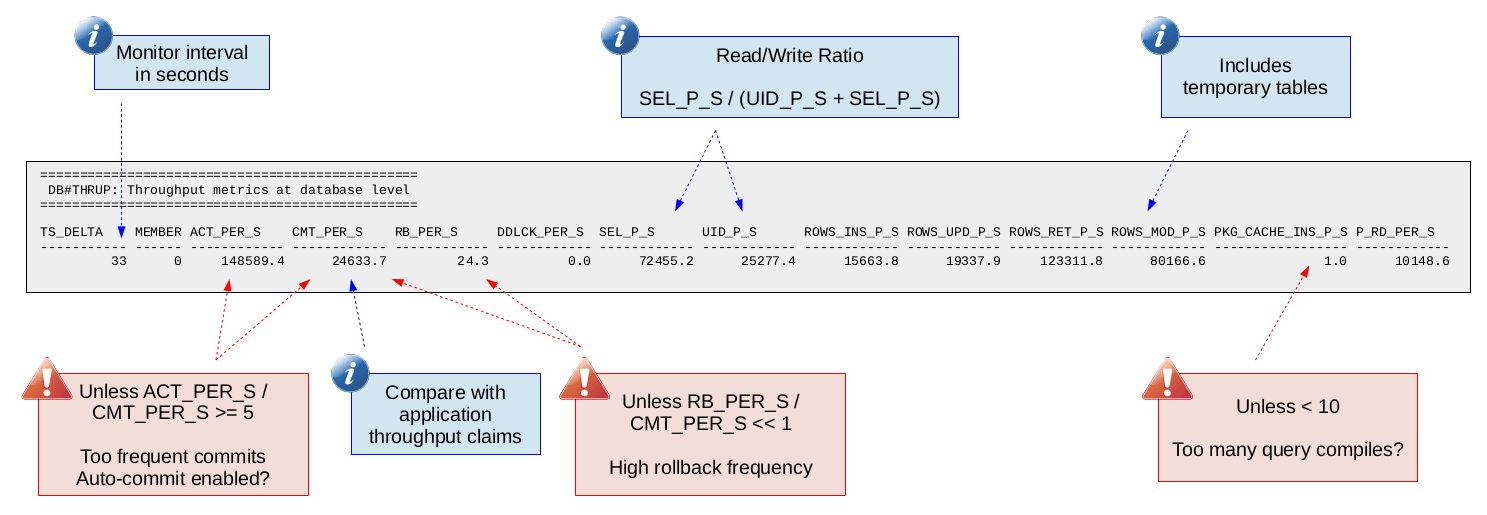
Having commits per second (throughput) from the database engine point of view can be useful to compare with what the application reports. Many times the bottleneck might be on the application side or you might tune something that does not improve the application side throughput but does improve throughput as measured on the database engine side. Looking at just the application throughput might lead you to believe the tuning was not productive but the database engine throughput tells a different story.
Commits per second is also useful for normalizing against rates in order to determine how frequent things like rollbacks, deadlocks and activities are happening per commit. This is helpful when trying to put numbers into context. For example, is 10 rollbacks per second high? Well if you are doing 10,000 commits per second then probably not but if you are doing 20 commits per second (one rollback every other commit) then yes.
Physical reads per second is a quick way to tell if you are looking at an environment with a high amount of disk read I/O. A high amount of disk read I/O might turn your focus to other disk I/O metrics in db2mon in order to confirm if your database engine execution time is being dominated by waiting on disk I/O.
Likewise the package cache inserts per second is a quick way to get an idea if your system is having to do a lot of query compilation. There are other metrics in db2mon that you can check to confirm if query compilation is in fact taking up a significant part of your database engine execution time like PCT_COMPILE in the "Database Time Breakdown" report (which we will see later). Looking at one metric and then being able to get confirmation from secondary metrics is one of the best things about db2mon. This is made possible through the various reports that are generated by db2mon at the database, connection and SQL statement levels. This way of performing analysis builds stronger theories that we can be more confident about. The trick is learning where to find all that data in the db2mon report which comes with practice analyzing db2mon reports.
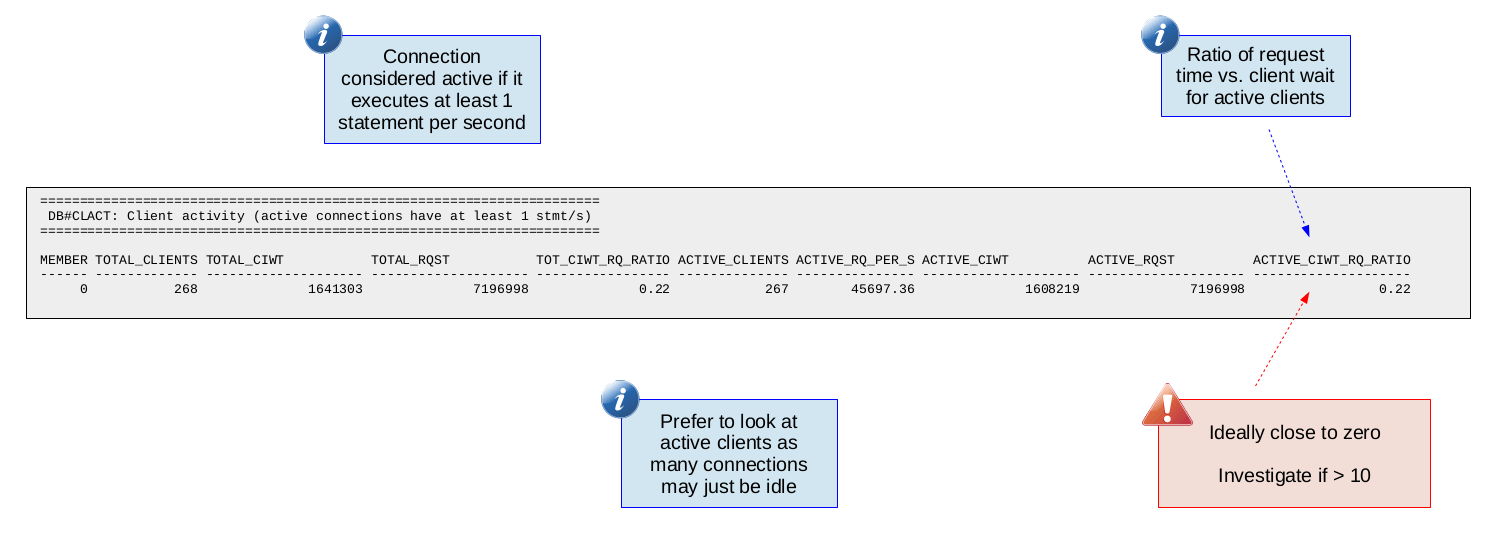
Client Activity (DB#CLACT)
This report is critical for understanding if a connection is spending more time on the application side or database engine side. Db2 provides a client idle wait metric which tells you if the database engine agent bound to a connection is waiting for work (idle). The ratio of this client idle wait time vs. request time gives how much time the database engine agent spends waiting for work vs. executing requests. If this client idle wait vs. request time ratio is high (greater than 10) then there should be some focus on understanding why this is the case.
Because many connections are intentionally left idle, this report provides the client idle wait vs. request time ratio for "active" connections. We define a connection as active if it executes at least 1 SQL statement per second. Users should focus on the active client idle wait vs. request time ratio (ACTIVE_CIWT_RQ_RATIO).
The following is a sample of this report:
Database Time Breakdown (DB#TIMEB)
This report gives some important metrics to help breakdown where time is going at a high-level during database engine execution. The metrics reported are:
- Total request time (TOTAL_RQST_TM)
- The metrics below are percentages of total request time (TOTAL_RQST_TM)
- Query compilation (PCT_COMPILE)
- Section execution (PCT_SECTION)
- Section sort operations (PCT_SORT)
- Section processing in columnar engine (PCT_COL)
- Synopsis processing in the columnar engine (PCT_COL_SYNOP)
- Commit processing (PCT_COMMIT)
- Rollback processing (PCT_RBACK)
- Connection request processing (PCT_CONN)
- Routine user code execution (PCT_RTN_USR_CODE)
- Online backup (PCT_BACKUP)
- Index build (PCT_IDX_BLD)
- Runtime statistics (PCT_RUNSTATS)
- Reorganization processing (PCT_REORG)
- Execution of LOAD (PCT_LOAD)
The percentages above are calculated by taking the time (for example, total_compile_time as a fraction of total_rqst_time). It is important to understand the "Time-spent monitor element hierarchy" provided in the Db2 documentation here. Knowing this hierarchy allows us to determine what percentage of database request time is spent executing in the various subcategories (like query compile time). If we determine that some subcategory is a significant part of total request time then we can focus our analysis on that specific subcategory.
The following is a sample of this report:
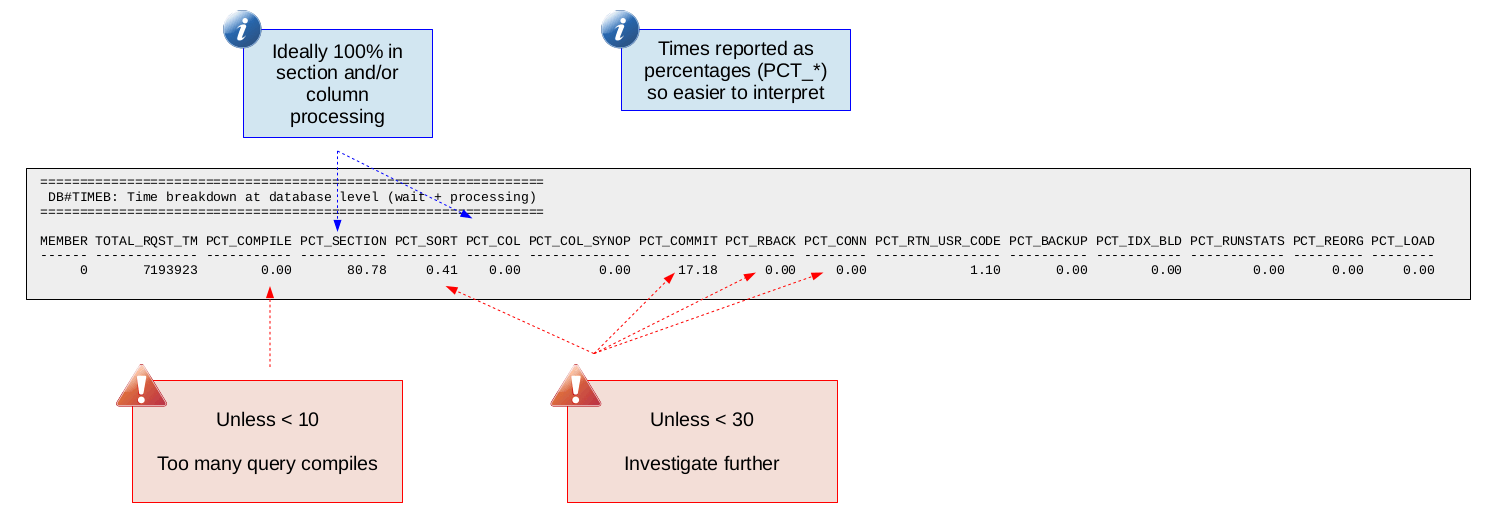
Seeing a high percentage of time in section or columnar engine execution is normal. In such cases you would need to continue looking into subsequent db2mon reports (like the one we will discuss next) to understand where the time is going. If however you see a high percentage of time spent in some other area (like PCT_CONN for example) this is important to know. Otherwise you might spend a lot of time trying to tune SQL but your real problem (continuing with the PCT_CONN example) exists before a SQL statement even starts executing in the database engine.
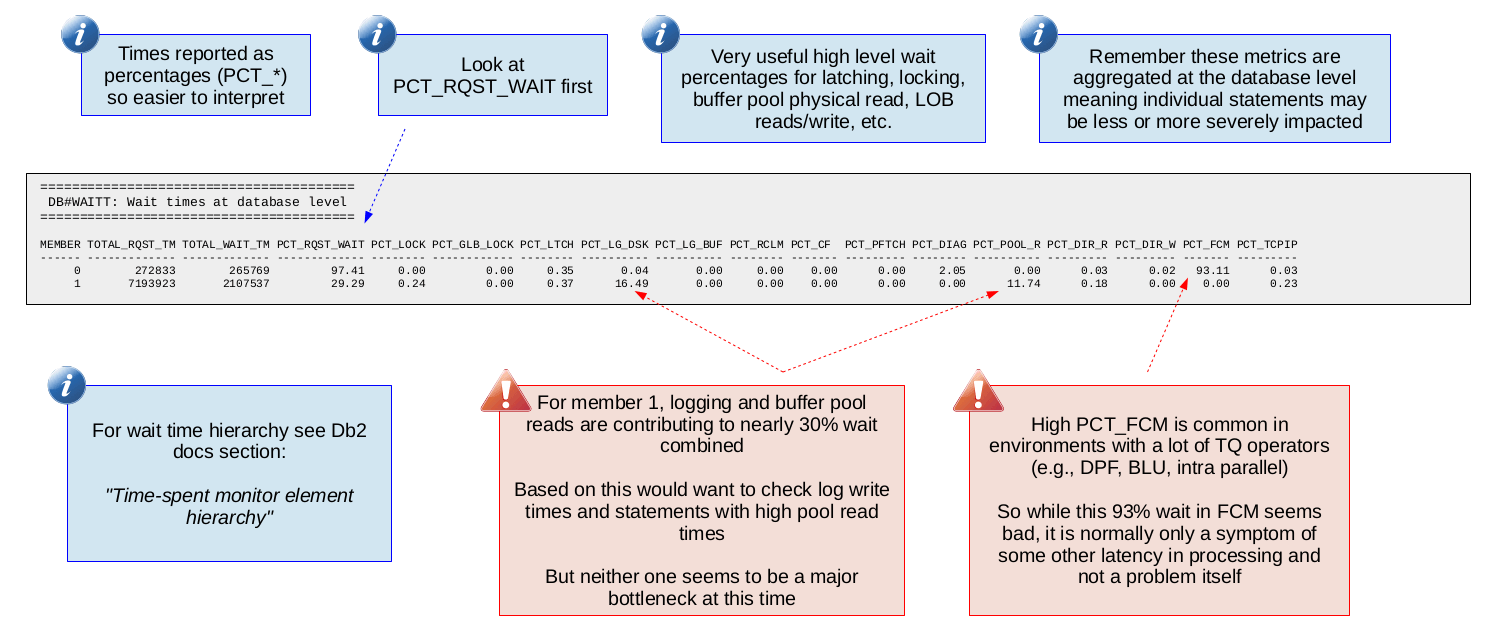
Database Wait Time Breakdown (DB#WAITT)
This is the first report in which we start to see the various wait time metrics that Db2 provides. These wait metrics enable you to break down the execution time and say precisely how much time is spent waiting on things like locks, latches, log writes and disk read I/O. A "wait" is essentially a stall in database execution (for example waiting on a lock) and we want to ensure wait times are not a large fraction (over 30%) of database execution time. In this report we see these wait metric rolled-up at the database level but db2mon also provides this information at the SQL statement and connection levels.
The following is a list of the wait metrics currently included in this report. As more wait metrics are added to Db2, you can expect to find them added to db2mon as well.
- Total request time (TOTAL_RQST_TM)
- The metrics below are percentages of total request time (TOTAL_RQST_TM)
- Percentage of execution time spent waiting (PCT_RQST_WAIT)
- The wait times below should add up to PCT_RQST_WAIT
- Lock wait (PCT_LOCK)
- Global lock (Db2 pureScale) wait (PCT_GLB_LOCK)
- Latch wait (PCT_LATCH)
- Log disk wait (PCT_LG_DSK)
- Log buffer wait (PCT_LG_BUF)
- Page reclaim (Db2 pureScale) wait (PCT_RCLM)
- Cluster Caching Facility (Db2 pureScale) wait (PCT_CF)
- Prefetch wait (PCT_PFTCH)
- Diagnostic log write wait (PCT_DIAG)
- Bufferpool read wait (PCT_POOL_R)
- Direct read wait (PCT_DIR_R)
- Direct write wait (PCT_DIR_W)
- FCM wait (PCT_FCM)
- TCP/IP wait (PCT_TCPIP)
The following is a sample of this report:
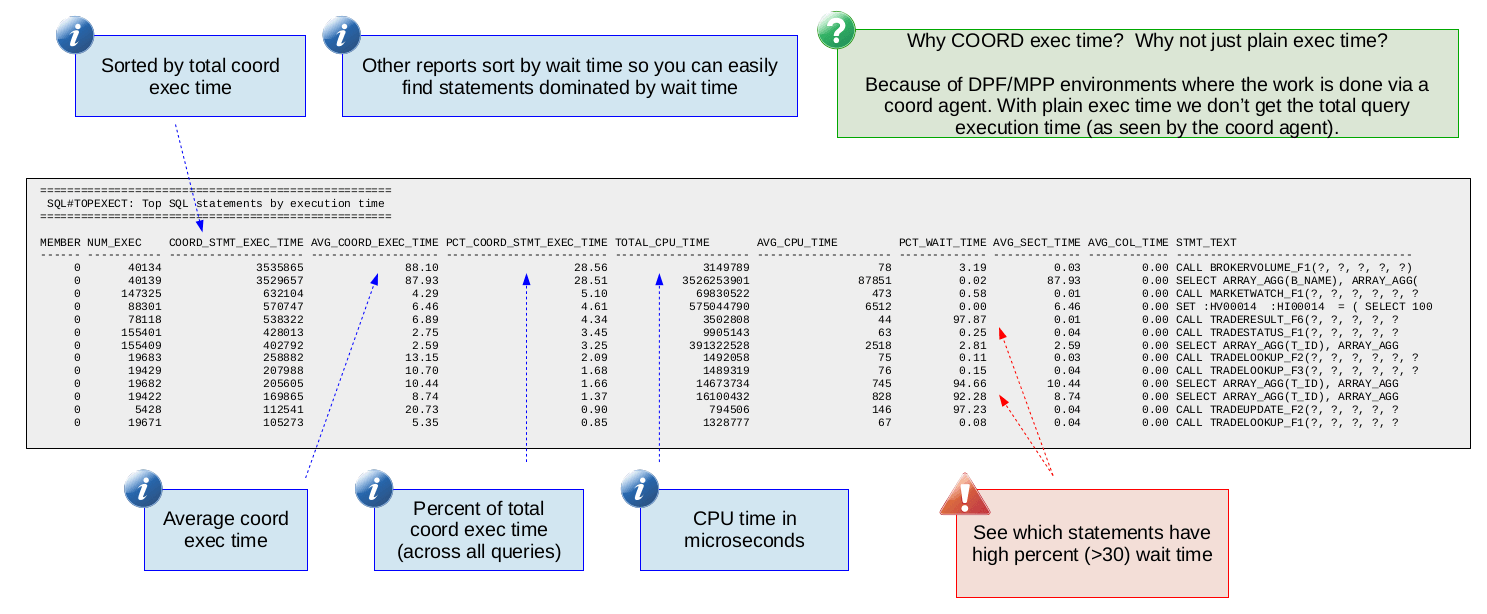
Top SQL Statements by Execution Time (SQL#TOPEXECT)
The next two reports are at the SQL statement level meaning the statistics are per SQL statement allowing us to focus in on particular SQL statements. This report is a high-level report with the following important metrics:
- Average execution time of the statement (AVG_COORD_EXEC_TIME)
- Percentage of total database execution time accounted for by the statement (PCT_COORD_STMT_EXEC_TIME)
- Average and total CPU time consumed during execution of the statement (AVG_CPU_TIME, TOTAL_CPU_TIME)
- Percentage of time spent waiting during execution of the statement (PCT_WAIT_TIME)
Average execution time is critical for obvious reasons. We look at coordinator execution time to account for clustered environments (like DPF or MPP) where the work is done via coordinator agents. In such environments the true execution time is measured from the coordinator agent. Note that in non-clustered environments, looking at coordinator execution time is still valid it is just the same as plain execution time.
PCT_COORD_STMT_EXEC_TIME tells you (as a percentage) what a particular SQL statement accounts for in terms of the total (across all statements) time spent executing statements. For example if you have three statements with total execution times of 10, 30 and 160 respectively. Statement 3 would have a PCT_COORD_STMT_EXEC_TIME of 80. In other words, with this metric you get a sense for how heavy a statement is relative to the other statements running on the system. This can be helpful when trying to decide which statement to focus your tuning efforts on.
Average and total CPU time consumed is helpful to understand which statements are the top CPU consumers. Sometimes statements with relatively high CPU consumption may be suffering from a sub-optimal access plan. For example, reading more rows than necessary can lead to high CPU and this can sometimes be resolved by simply adding an appropriate index.
Perhaps the most insightful metric in this report (along with average execution time) is PCT_WAIT_TIME which tells you (as a percentage) what fraction of the statement's execution time was spent blocked waiting for something. A value of PCT_WAIT_TIME that is 30 or larger is a good indication that you can improve the execution time of your statement by addressing the underlying wait. How you address the wait is of course dependent on the type of wait. For example, pool read wait occurs when a page is not found in the bufferpool and now the statement must wait for it to be synchronously read from disk. One way to deal with such a wait would be to increase the size of the bufferpool.
Be aware that a high PCT_WAIT_TIME may not be worth investigating further if the statement already has a short average execution time. For example a statement that runs in 1 ms with a 50% wait time might not be worth looking at since the best you could hope for is improving the execution time from 1 ms to 0.5 ms. Whether or not saving that 0.5 ms matters depends on what your range of tolerable database response times is.
The following is a sample of this report:
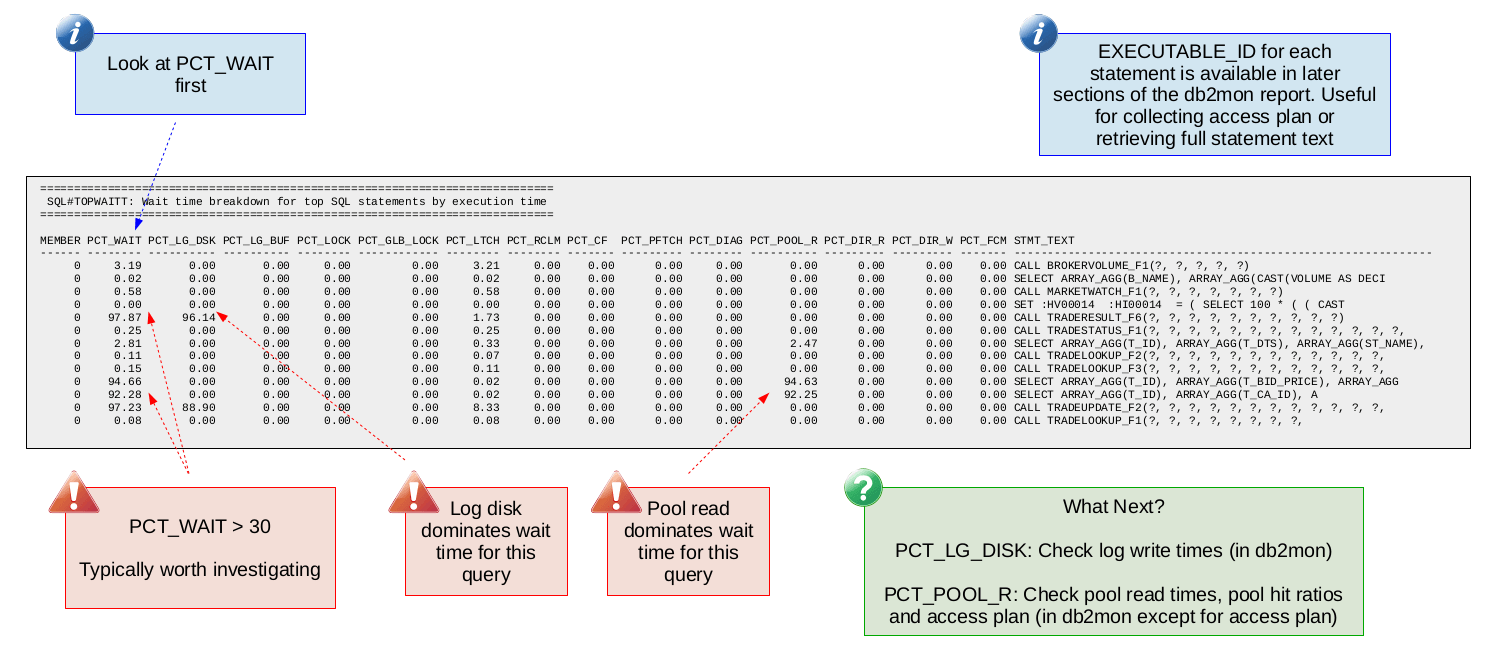
Top SQL Statements by Execution
Time Wait Time Breakdown (SQL#TOPWAITT)
This report is very similar to the Database Wait Time Breakdown (DB#WAITT) report except that the metrics are reported per SQL statement. The names of the wait metrics (like PCT_LOCK, PCT_LTCH, etc.) are exactly the same as those in DB#WAITT so if necessary you can review the description of that report to remind yourself what each of the different wait metrics are.
This report allows you to breakdown where the wait time is for individual SQL statements. The idea is you would have identified a SQL statement with high wait time in the "Top SQL Statements by Execution Time" (SQL#TOPEXECT) report and now you would look at this report to understand what is causing that wait time (for example, is it lock wait, latch wait, a combination of different waits, etc.). If you see some wait time that is 30 or higher (like PCT_LOG_DISK in the sample report below) then you will likely want to look at other db2mon reports related to that wait time. In the case of log disk wait, you would probably want to look at the log disk write times. Similarly if the wait time was dominated by lock wait then you would want to look at the lock wait db2mon report to get an idea of what lock waits are happening.
The following is a sample of this report:
Finding common bottlenecks
With db2mon we try to make finding common bottlenecks very simple. The table below lists some common bottlenecks and the corresponding db2mon metrics that you would use to confirm whether or not you are hitting that bottleneck.
Observing the primary metrics below is an indication of a bottleneck. The secondary metrics can be used to drill down and help pin-point the actual cause of the bottleneck. The "Next Steps" column includes either ways to address the bottleneck or additional data to collect to further understand the root cause of the bottleneck.
|
Bottleneck |
Primary Metrics |
Secondary Metrics to Consider |
Next Steps |
|
Slow Log Writes |
PCT_LG_DISK over 30 |
Log write time in DB#LOGWR |
Investigate log disk file system and storage subsystem |
|
Latch Contention |
PCT_LTCH over 30 |
Hot latches in LTC#WAITT |
Due to the low-level nature of latches you will probably want to open a ticket with Db2 support |
|
Disk I/O |
PCT_POOL_R, PCT_DIR_R or PCT_DIR_W over 30 |
Bufferpool (BP) sizes in BPL#SIZES |
Increase BP size, inline LOBs, check access plan, check underlying storage |
|
Expensive Query (High CPU, Sorting, Spilling) |
Relatively high AVG_COORD_EXEC_TIME, PCT_COORD_STMT_EXEC_TIME and AVG_CPU_TIME compared to other queries |
Rows read / rows returned ratio in SQL#TOPROWS |
Check access plan, check for spilling (of sorts or joins) to disk |
|
Lock Contention |
PCT_LOCK over 30 |
Point in time lock waits in START#LOCKW and END#LOCKW |
Tune application (for example change isolation level) |
|
Page Reclaims (Db2 pureScale) |
PCT_RCLM over 10 or PCT_LTCH over 30 with non-zero PCT_RCLM |
Find what tables (or indexes) are causing reclaims from PAG#RCM and PAG#RCSMP |
Enable append mode (for insert-heavy tables), tune index (for example add CURRENT MEMBER column), table partitioning, enable EHL |
|
CF Wait (Db2 pureScale) |
PCT_CF over 30 |
CF round trip command times in CF#RTTIM |
Increase CF workers |
Next we will look at some examples of what some of these common bottlenecks look like in actual db2mon reports.
Common bottleneck example: Slow log writes
The following db2mon report samples show you what a typical bottleneck due to slow log writes looks like.
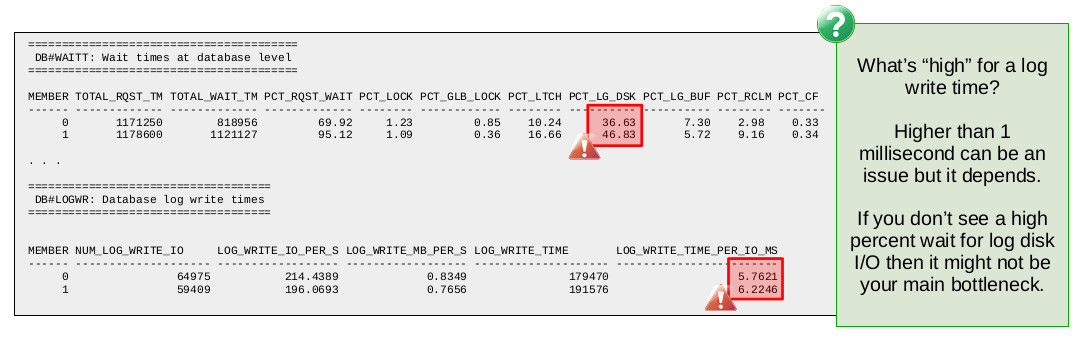
First of all we see that from the database wait times report (DB#WAITT) the percentage of wait time spent in log disk wait is 36.6 and 46.8 on members 0 and 1 respectively. Both values are greater than our suggested threshold of 30 so we should try to understand the cause of the log disk wait.
Following the table above for finding common bottlenecks, we should check the log write times in the DB#LOGWR report. There we see that the time per log write I/O is 5.7 and 6.2 ms on members 0 and 1 respectively. As a general rule of thumb, log write times are considered high for values greater than 1 ms.
In this case we are in the 5-6 ms range so this is sufficient evidence to suggest slow log writes are the cause of the high log disk wait. The next step here should involve analyzing the underlying file system and disks in order to determine if anything can be done to reduce the log disk write latency.
Note that high log write times without the corresponding high percent wait for log disk might not be indicative of a bottleneck. For example, it could be the case that the workload is nearly read-only which reduces the impact of slow log writes. Or it could be the case that there is some other bottleneck that is overshadowing the slow log writes. For this reason we use the percent wait metrics as our primary metrics when identifying what the bottleneck is.
Common bottleneck example: Latch contention
The following db2mon report samples show you what a typical bottleneck due to latch contention looks like.
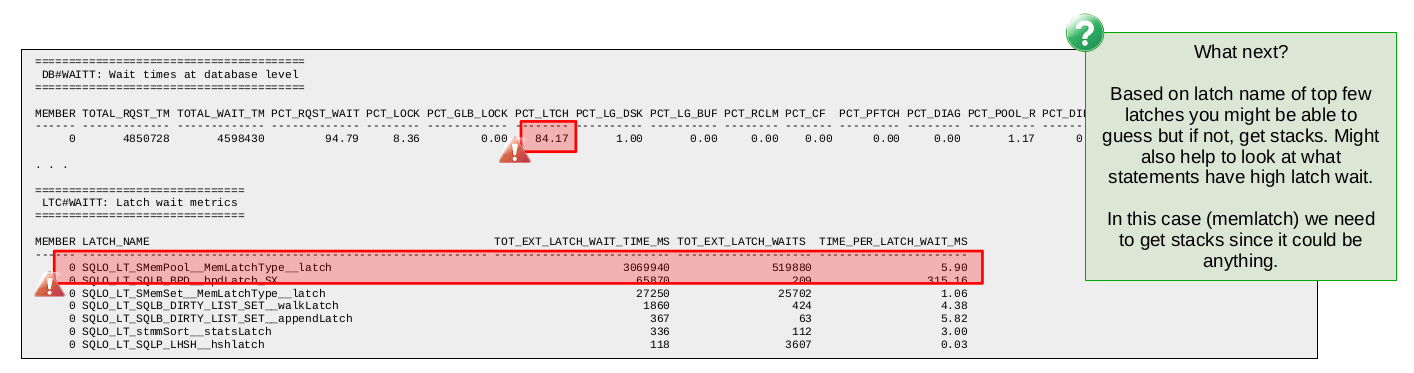
Again we start with the wait times at the database level where we see latch wait at 84. Clearly this points to a significant bottleneck due to latch contention.
Next we look at the latch wait report in db2mon (LTC#WAITT). This report provides a list of latch types along with some statistics about how many latch waits occurred, the total amount of time spent waiting for the latches and the average amount of time spent waiting for a latch of that type. With this we can get an idea of what latch types are involved in the latch contention and that might give us some clues as to where the problem might be.
That said, some of the latch types are used in so many different parts of the engine that it can be difficult to gain any insight even if you do identify it as the latch type behind the contention. That is the case in the sample above where we find the MemLatch is the top latch. Because this type of latch is used all over the engine we would need additional low-level data to determine what the source of the latch contention is.
Debugging latch contention situations is challenging for users given the low-level nature of latches. Often a support ticket will be required since finding the root cause typically requires a deep understanding of the underlying algorithms and normally involves combing through quite a bit of low-level data not normally available to users.
In the last two common bottleneck examples we saw, the wait times were observed at the database level. Note that it would also have been possible to observe these wait times at the SQL statement and connection levels. Sometimes you might want to check wait times at all three levels (database, SQL statement and connection) to give yourself more confidence about what the data is telling you.
Common bottleneck example: Slow disk reads
The following db2mon report samples show you what a typical bottleneck due to slow disk reads looks like.
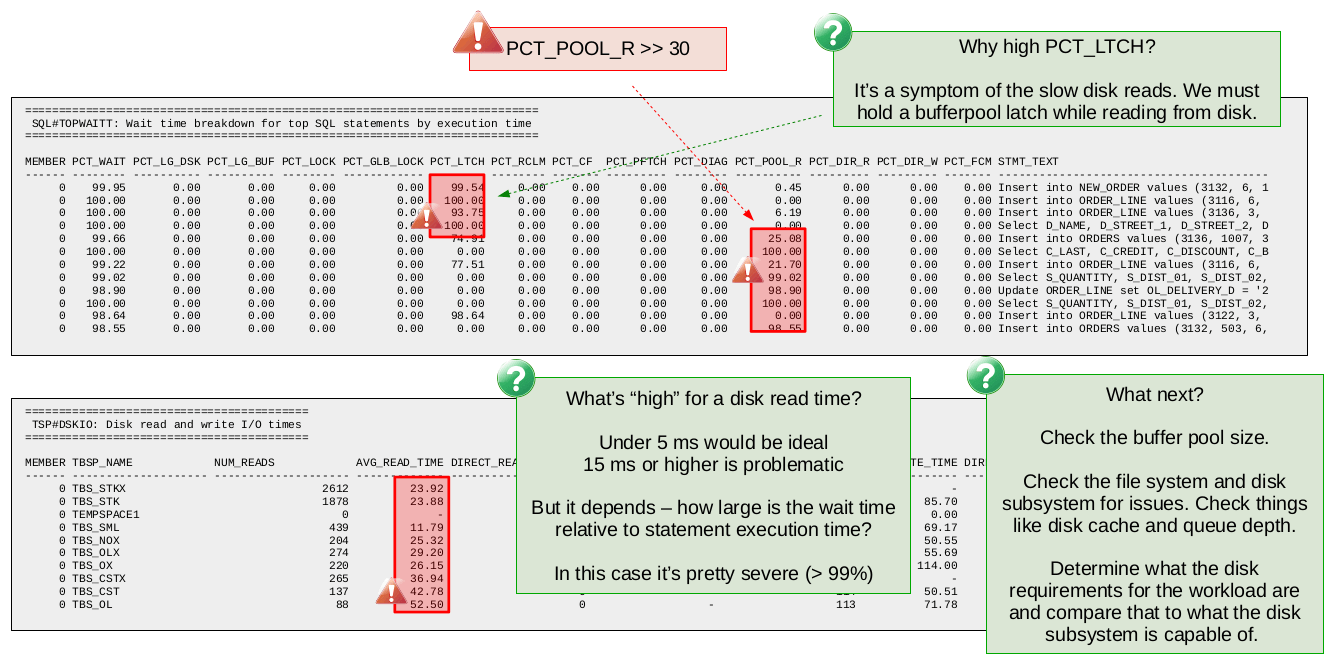
In this case we start looking at the SQL statement wait time breakdown (SQL#TOPWAITT) report. We could have started with the database wait time report as before but we use the SQL statement wait time report this time so you can see what that looks like.
The first sign of a problem is that so many of the SQL statements are showing wait times (PCT_WAIT) over 90%. The next step is to look at the breakdown of the wait time to see what type of wait we are dealing with. In this case we see that most statements are showing either latch (PCT_LTCH) or pool read wait (PCT_POOL_R).
We could look at the latch wait report to see which latch type is causing the contention. It is not shown here but chances are high that you will just see bufferpool page latches as the top latch type. The reason for this is the high pool read wait. In order to read a page from disk into the bufferpool Db2 must exclusively latch (i.e., lock) the bufferpool page while the page is being read from disk. As a result of this, if another Db2 thread requests the same page, it must now wait for the latch. So you see that the latch contention in this case is actually a symptom of the disk read wait.
Knowing this behaviour, we ignore the latch wait and instead focus on understanding the reason behind the high pool read wait. Looking at the average time per disk read in db2mon tells us all we need to know in this case. We see that the average time per disk read is quite high with an average around 25 ms and a maximum of 52 ms. As a rule of thumb we suggest disk read times over 15 ms can be problematic.
So given the extremely high pool read wait and the higher than recommended disk read times, we would be confident in concluding here that the bottleneck is due to slow disk reads. The next steps at this point might involve checking the bufferpool sizes (maybe we are doing more reads than we have to due to an incorrectly configured bufferpool) or checking the file system and underlying disks for any issues.
Common bottleneck example: Expensive query (CPU intensive)
The following db2mon report samples show you what a bottleneck due to a CPU intensive query might look like.
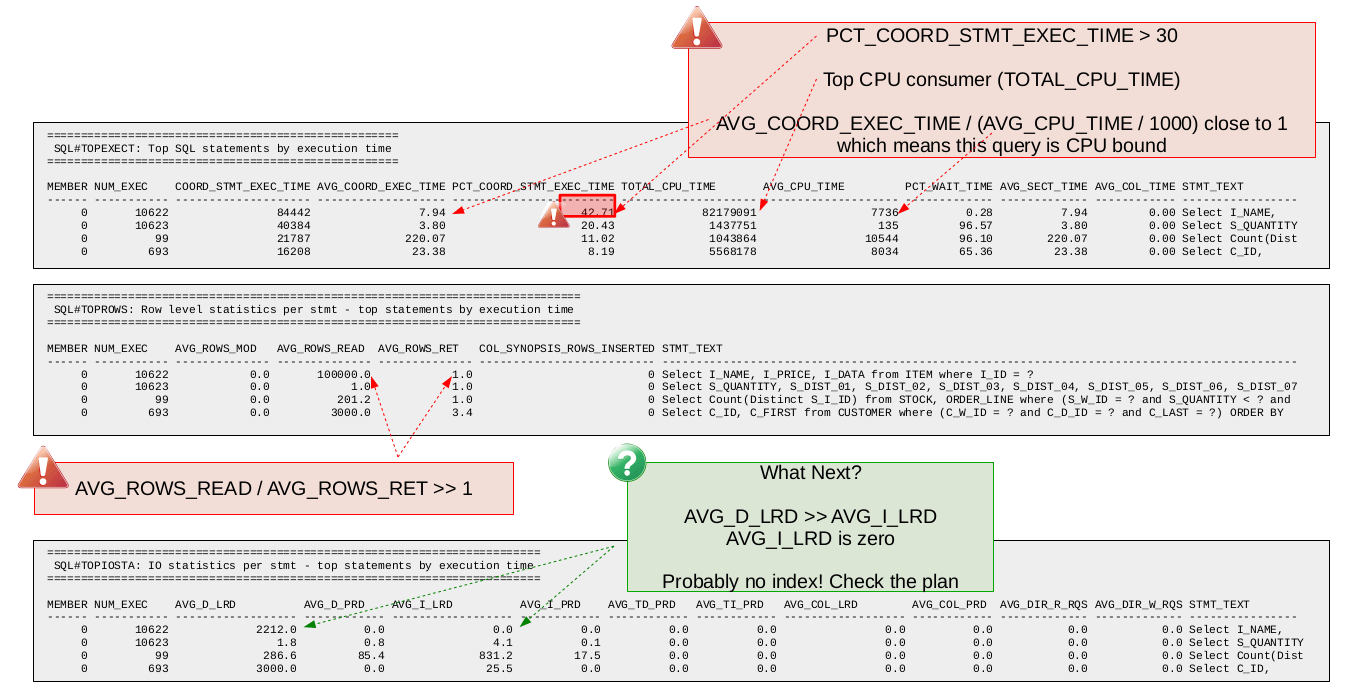
Since we are looking for expensive queries we start with the db2mon report showing top SQL statements by execution time (SQL#TOPEXECT). First we look for any SQL statement that is dominating total execution time using the PCT_COORD_STMT_EXEC_TIME metric. In this case we find the top SQL statement accounts for about 42.7 percent of all time spent executing SQL statements. This same statement is also the top CPU consumer (by far) based on TOTAL_CPU_TIME. Lastly, we look at the ratio of AVG_COORD_EXEC_TIME over AVG_CPU_TIME / 1000 (/ 1000 is for conversion from microseconds to milliseconds) which in this is close to 1 which tells us that the SQL statement is CPU bound.
The fact that this SQL statement accounts for 42.7 percent of all time spent executing SQL statements is a good indication that tuning this query is worth the effort. Since this SQL statement is a query we can look at the row level statistics provided by db2mon to get an idea of the rows read vs. rows returned ratio. Looking at the SQL#TOPROWS report we see that the query in question has a rows read vs. rows returned ratio of 100,000. Ideally in OLTP environments such as this one, we would expect a rows read vs. rows returned ratio closer to 1 so there appears to be some room for improvement.
Next we look at the db2mon report showing logical and physical read statistics per SQL statement (SQL#TOPIOSTA). From this report we find that the query in question does no physical reads (i.e., it finds all the pages it needs in memory) which is not surprising given the query is CPU bound. However we do find that all the logical page reads are for data pages. There are zero logical page reads for index pages. This, together with the high rows read vs. rows returned ratio is a good indication that this query could benefit from an index.
The next step here is to check the access plan to confirm there is no index being used. Following that we would probably want to consider adding an appropriate index and measuring the impact it has.
Wrapping up
db2mon is an invaluable tool in the Db2 support organization. If you ever find yourself opening a support ticket for a Db2 performance issue, you will likely find that one of the pieces of data asked to be collected is db2mon. This is due to the wealth of information db2mon provides to the support team working on your ticket.
One of the nice things about db2mon is that you can run it from the comfort of the command-line. The output is text based so tools like grep, awk or custom scripts can be used to parse and extract the data that is most meaningful to you. Those more inclined towards graphical user interfaces might be more interested in something like IBM Data Server Manager which provides many of the same metrics in a more visual manner through your web browser.
db2mon is freely available and included in your Db2 installation starting in Db2 version 11.1. Users on a version of Db2 prior to 11.1 can find db2mon here. So there is nothing to stop you from trying it out for yourself!
Kostas Rakopoulos is a member of the Db2 Performance team at the IBM Toronto Lab and has a BSc in Computer Science from the University of Toronto. Since joining the Db2 Performance team in 2008, Kostas has worked on a wide range of Db2 offering types including Db2 pureScale (OLTP), Db2 Event Store (IoT) and Db2 Warehouse. Most recently, Kostas has been working on the Native Cloud Object Storage feature in Db2 Warehouse. Kostas can be reached at kostasr@ca.ibm.com.