Monitoring the new Multi-tier Storage Layer of Db2 Warehouse
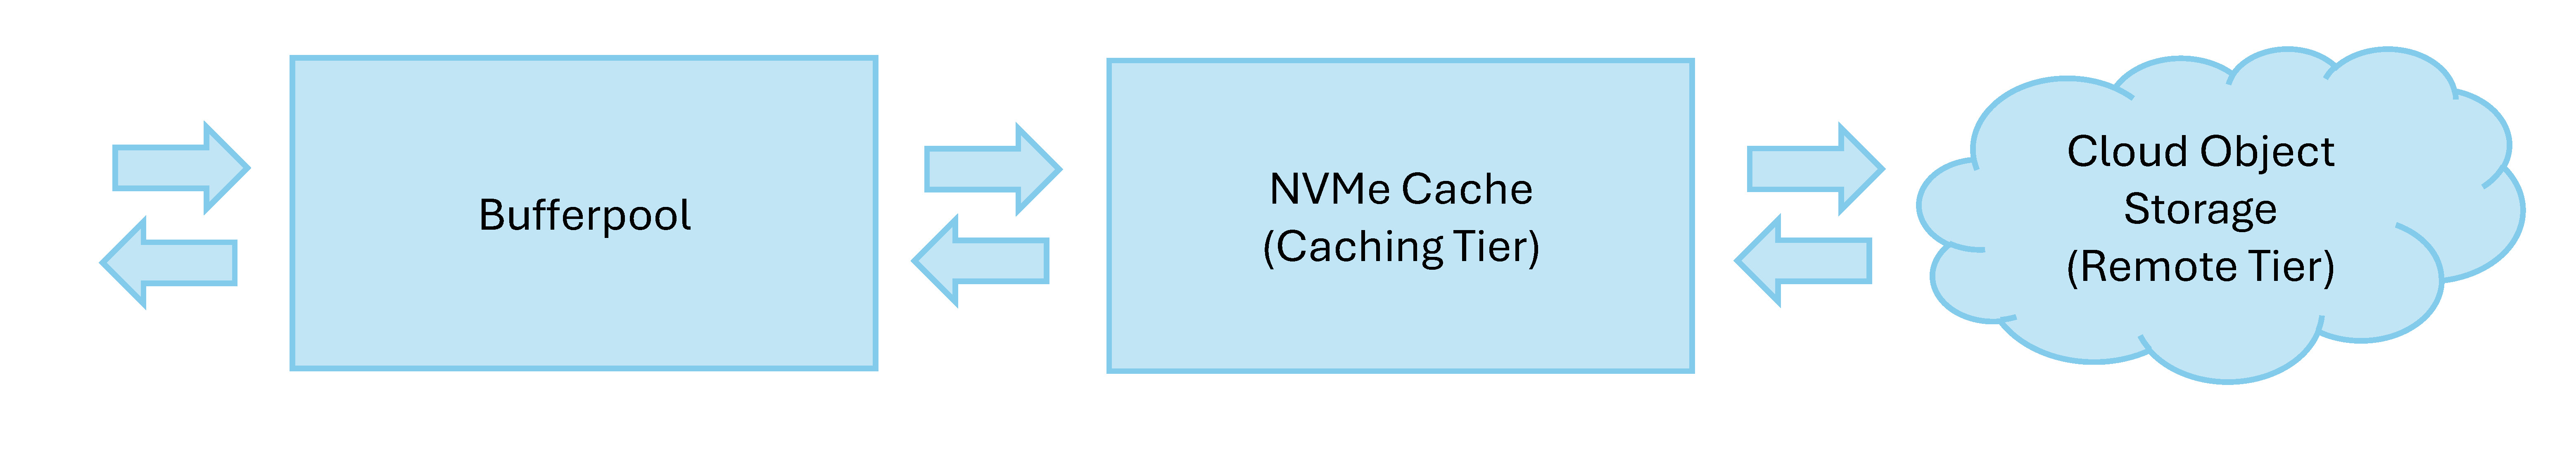
Db2 Warehouse has recently gone through a significant transformation with the addition of a storage layer that supports Cloud Object Storage (COS) as the main storage medium for column-organized tables. As discussed in a previous blog, one of the main challenges of this change was the difference in performance with traditional network attached block storage, which resulted in the need to introduce a new on-disk caching layer, in order to complement the existing in-memory caching layer. With this, now Db2 Warehouse implements a two-tier caching system for Remote Table Spaces that are backed by COS: the Buffer Pools continue to be the primary in-memory cache, and there is now an on-disk Caching Tier, which should be preferably backed by locally-attached NVMe drives for the best performance (and this is what is available by default in Db2 Warehouse on Cloud Gen3 instances). This Caching Tier sits between the Buffer Pools and Cloud Object Storage (a.k.a. the Remote Tier), allowing Db2 to maintain a significantly larger working set than what would be traditionally possible with the Buffer Pool alone, and help amortize the much higher request latency of Cloud Object Storage compared to block storage. The Local Caching tier is a crucial component for fast execution of queries and smooth operations when using Remote Table Spaces.
In this blog post, we will take a high-level overview of how this Caching Tier works, introduce some of the operations (like compaction) that take place behind the scenes, and most importantly the tools that Db2 provides to monitor their operations. We will also go over some examples and help you get the most out of this wonderful new feature.
Monitor Table Functions
Db2 offers an extensive set of monitor table functions to provide real-time statistics and metrics for query performance and the health of the system. Users can use these table functions to monitor the activity of their systems, identify performance bottleneck, and even incorporate their outputs into scripts and applications to analyze these metrics.
Some examples of the relevant monitor table functions are:
- MON_GET_TABLESPACE
- MON_GET_BUFFERPOOL
- MON_GET_WORKLOAD
- MON_GET_CONNECTION
- MON_GET_PKG_CACHE_STMT
- MON_GET_TABLE
- MON_GET_ACTIVITY
These monitor table functions can be queried using SELECT statements like:
-
- select * from table (MON_GET_TABLESPACE ('OBJSTORESPACE1', -2))
- select * from table (MON_GET_BUFFERPOOL ('IBMDEFAULTBP', -2))
and more information can be found online here.
New elements were added to these monitor table functions for the new Caching Tier, as well as for the new operations (e.g. compaction) necessary to maintain the data on the remote tier in COS. We will go through them in later sections.
First let’s look at how the Caching Tier works by looking at what happens when data is being read from a table in a Remote Table Space, and the monitor elements associated with this operation. We will be using column-organized tables in these examples, so the elements have “_COL_” in their names.
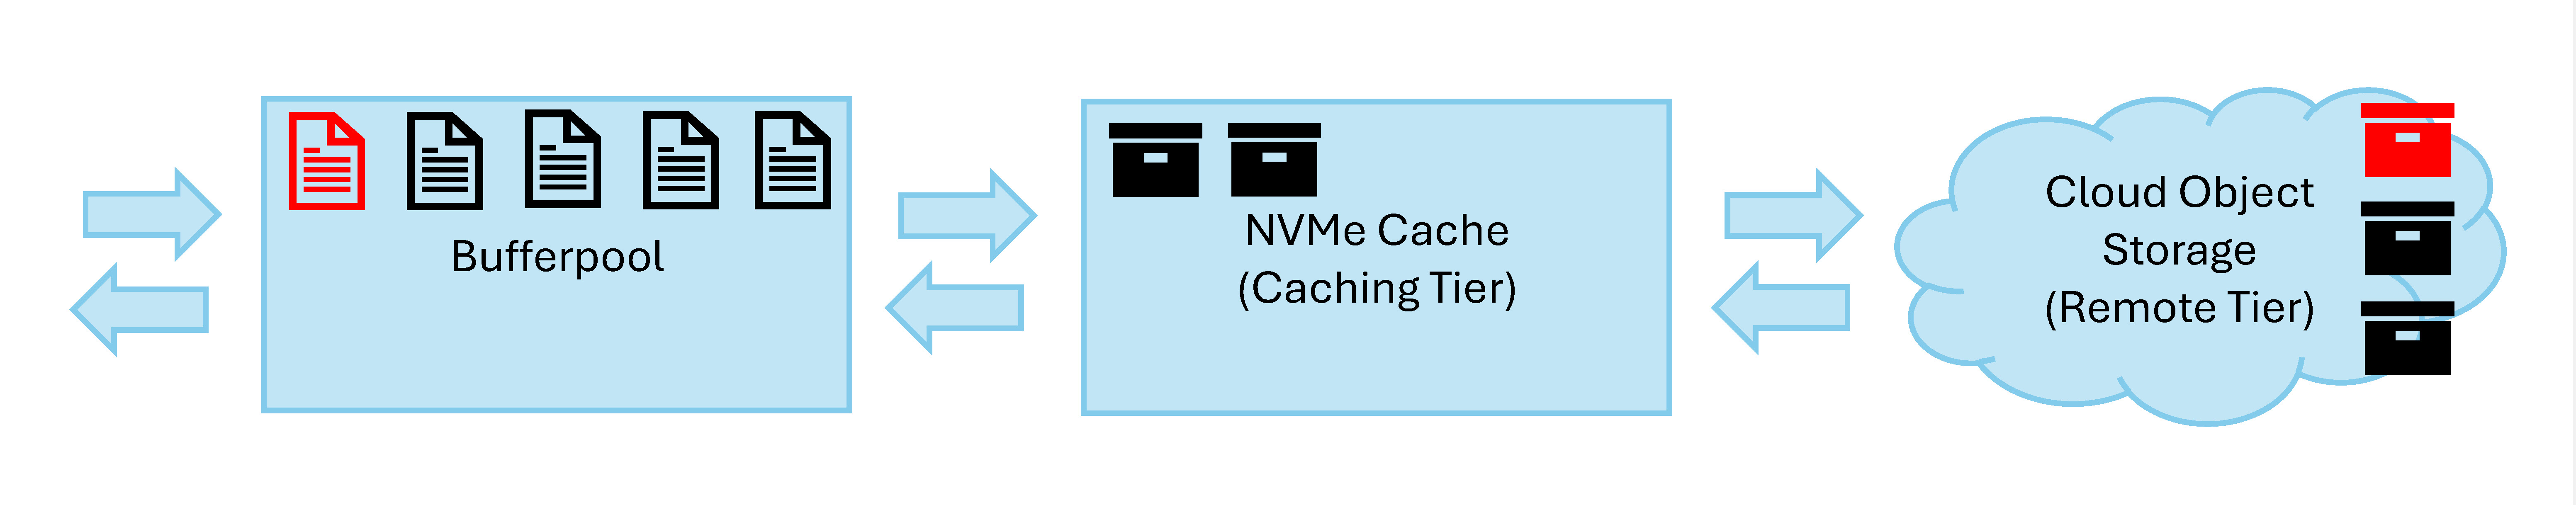
When a query needs a page from a table in a Remote Table Space, it first tries to get it from the Buffer Pool, and the read request is being counted as “POOL_COL_L_READS” (the “L” here stands for “Logical”). If it is found there, it will also be counted as “POOL_COL_LBP_PAGES_FOUND”. So far it is the same as with a table in block storage table space.
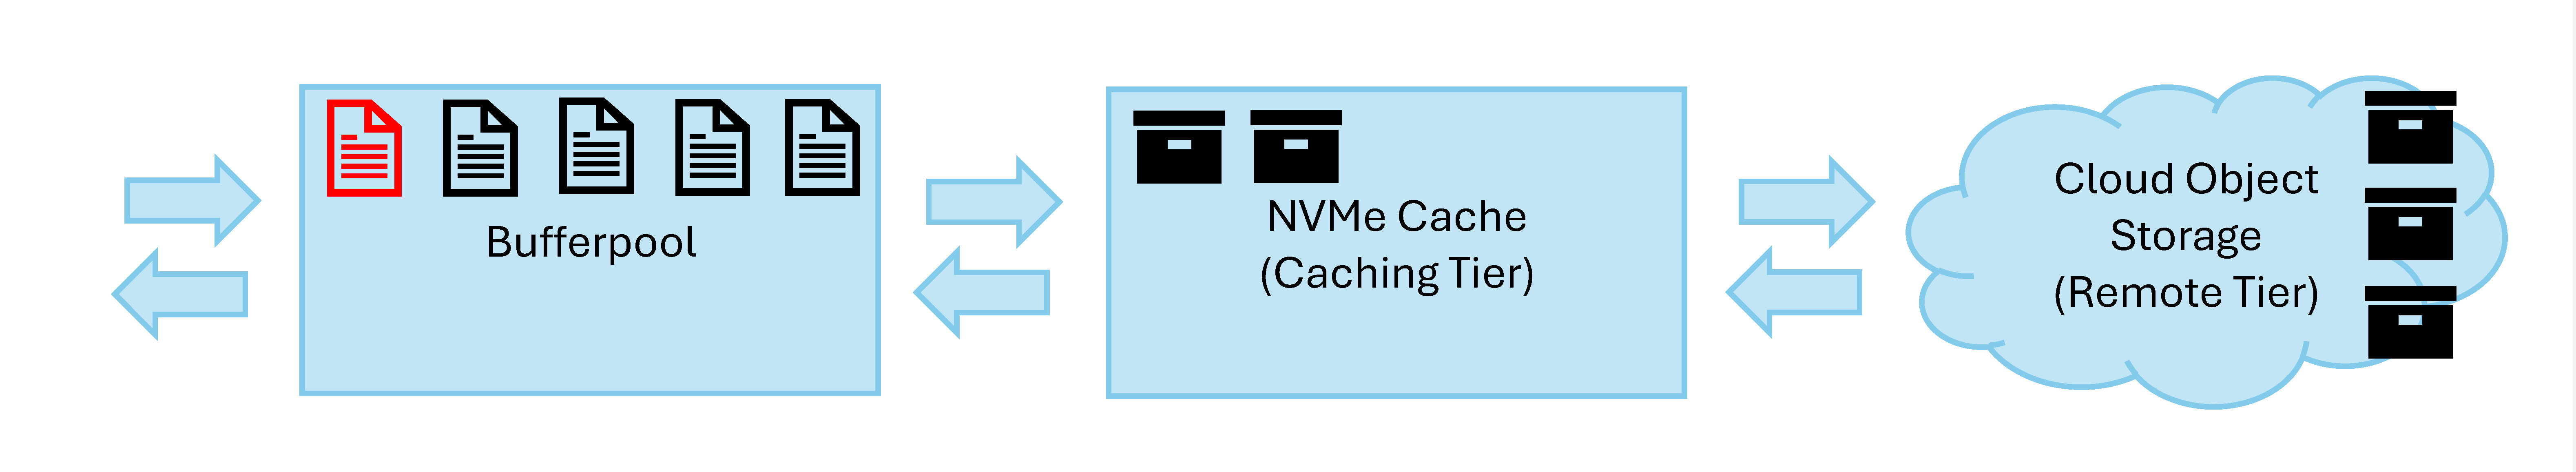
But if the page is not found in the Buffer Pool, Db2 will look for the page in the Caching Tier. This read request will be counted by a newly added element called “POOL_COL_CACHING_TIER_L_READS”. If it is found in the Caching Tier, then it will also be counted as “POOL_COL_CACHING_TIER_PAGES_FOUND” (another new element), and the page will be brought into the Buffer Pool. Otherwise Db2 will try to retrieve it from COS (the remote tier).
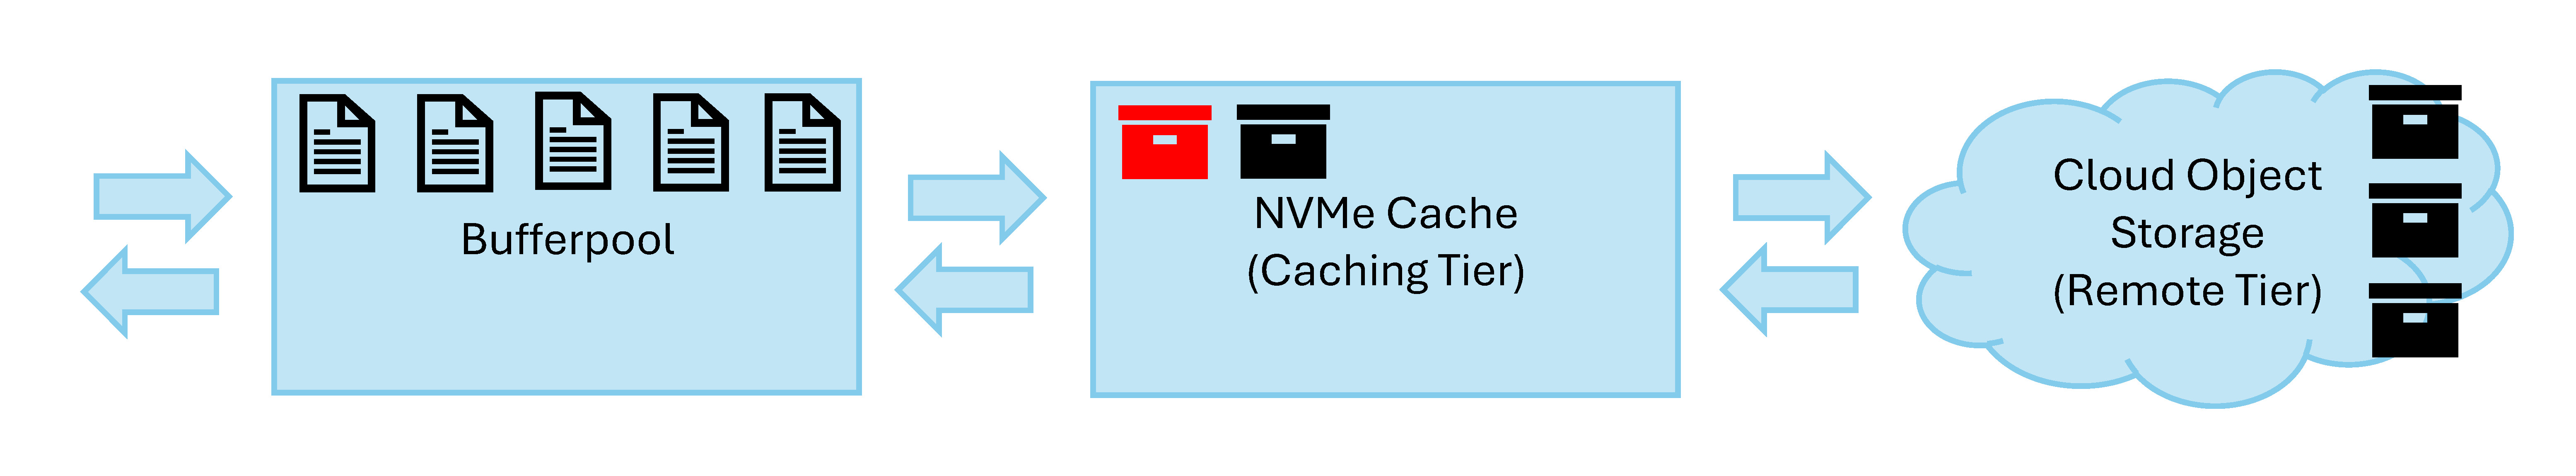
If the page wasn’t found in both the Buffer Pool and the Caching Tier, Db2 will retrieve it from COS and place it in the Caching Tier, that counts as “POOL_COL_P_READS”. Note that “POOL_COL_P_READS” is an existing element for counting the number of physical reads from the disks for block storage table spaces, now for Remote Table Spaces it is counting the number of reads from COS (the remote tier). One can think of P_READS as slow reads from the lowest level of storage.
Now, something about the inner working of Remote Table Spaces. Although data are being organized as pages internally by Db2, they are being stored on COS and retrieved to the Caching Tier as SST objects (refer to the blog post for a description of SST objects in the new Remote Storage Layer). Each SST object can be megabytes in size and contains hundreds or even a thousand pages, but only the requested pages will be placed in the Buffer Pool. Also, only the read requests that pull in SST objects from COS would be counted as “POOL_COL_P_READS”, which means one “POOL_COL_P_READS” could potentially bring in a thousand pages.
By using the newly added monitoring elements, namely “POOL_COL_CACHING_TIER_L_READS” and “POOL_COL_CACHING_TIER_PAGES_FOUND”, and the existing elements one could get a precise number of pages read from each of the three storage tiers as well as their hit rates.
The following diagram, using synchronous reads (reads done by the agents) and column-organized tables as example, summarizes the number of reads and the number of pages found (hit) from each tier.
Explanation of the Formulas:
![]()
- Asynchronous reads that find pages already in Buffer Pool increase POOL_COL_LBP_PAGES_FOUND as well as POOL_ASYNC_DATA_LBP_PAGES_FOUND, hence the subtraction above to get only the number for synchronous reads.
![]()
- POOL_COL_CACHING_TIER_PAGES_FOUND include the number of pages found for both synchronous and asynchronous reads, hence subtracting it to get only the number for synchronous reads.
![]()
- POOL_COL_P_READS also include the number of asynchronous reads from storage tier, so subtracting POOL_ASYNC_COL_READ from it to get the number of synchronous reads.
With both the number of reads and hits from each tier, we can calculate their hit rates.
In general, “%hit = number of pages found in a tier divided by the number of reads from that tier”, so for each tier, the formulas for their hit rates are:
![]()
![]()
Similarly, a new set of monitoring elements for asynchronous reads (reads done by prefetchers) were added for the Caching Tier, and the following diagram shows the number of reads and hits from each tier for asynchronous reads.
And the formulas for Buffer Pool and cache hit rate for asynchronous reads are:
![]()
![]()
Here is a list of the new monitoring elements for synchronous and asynchronous reads added for the Caching Tier:
POOL_[COL|DATA|INDEX|XDA]_CACHING_TIER_L_READS
POOL_[COL|DATA|INDEX|XDA]_CACHING_TIER_PAGES_FOUND
POOL_ASYNC_[COL|DATA|INDEX|XDA]_CACHING_TIER_READS
POOL_ASYNC_[COL|DATA|INDEX|XDA]_CACHING_TIER_PAGES_FOUND
POOL_TEMP_[COL|DATA|INDEX|XDA]_CACHING_TIER_L_READS
POOL_TEMP_[COL|DATA|INDEX|XDA]_CACHING_TIER_PAGES_FOUND
POOL_CACHING_TIER_PAGE_READ_TIME
POOL_ASYNC_CACHING_TIER_READ_TIME
The monitoring elements mentioned so far were for reads, there are also new monitoring elements for writes to the Caching Tier (the NVMe cache) and the remote tier (COS) added. They are:
CACHING_TIER_WRITE_REQS
CACHING_TIER_WRITE_TIME
CACHING_TIER_WRITE_BYTES
REMOTE_TIER_WRITE_REQS
REMOTE_TIER_WRITE_TIME
REMOTE_TIER_WRITE_BYTES
I mentioned earlier that there are some operations that take place behind the scenes when using Remote Table Spaces, one of these operations is compaction. For Remote Table Spaces, Db2 pages are stored in a Log-Structured-Merge Tree (LSM Tree) structure on COS. Each LSM tree is composed of many Sorted String Table objects (SST objects). These SST objects could contain up to a thousand pages. They will go through an asynchronous background process of compaction to improve their clustering and speeding up finding objects within the tree. During compaction, SST objects in one level of the LSM tree were re-organized and written to a lower level, then the original SST objects would be deleted. If the SST objects to be compacted were not present in the cache, they will be read from the remote tier. The I/O involved in this process are monitored by these new elements:
COMPACTION_READ_REQS
COMPACTION_READ_TIME
COMPACTION_READ_BYTES
COMPACTION_WRITE_REQS
COMPACTION_WRITE_TIME
COMPACTION_WRITE_BYTES
Besides, to achieve maximum performance, the Caching Tier (the NVMe cache) is locally attached and not replicated. To ensure write consistency we rely on a Remote Storage Layer Write-Ahead-Log (RSL WAL). And the write I/O to the RSL WAL is monitored by a set of new elements:
LOCAL_TIER_WRITE_REQS
LOCAL_TIER_WRITE_TIME
LOCAL_TIER_WRITE_BYTES
With these elements, one can easily tell how much were written to each of these tiers, how long it took as well as the average size of each request.
Now let’s take a look at some examples.
Here I was doing a table scan on a table with 1.8 billion rows right after Db2 was started.
SELECT
SUM(SS_SOLD_DATE_SK), SUM(SS_SOLD_TIME_SK), SUM(SS_ITEM_SK), SUM(SS_CUSTOMER_SK), SUM(SS_CDEMO_SK), SUM(SS_HDEMO_SK), SUM(SS_ADDR_SK), SUM(SS_STORE_SK), SUM(SS_PROMO_SK), SUM(SS_TICKET_NUMBER), SUM(SS_QUANTITY), SUM(SS_WHOLESALE_COST), SUM(SS_LIST_PRICE), SUM(SS_SALES_PRICE), SUM(SS_EXT_DISCOUNT_AMT), SUM(SS_EXT_SALES_PRICE), SUM(SS_EXT_WHOLESALE_COST), SUM(SS_EXT_LIST_PRICE), SUM(SS_EXT_TAX), SUM(SS_COUPON_AMT), SUM(SS_NET_PAID), SUM(SS_NET_PAID_INC_TAX), SUM(SS_NET_PROFIT)
FROM
NITRO2.STORE_SALES
Because it was the first time I ran this query, none of its data resides in the Caching Tier, so we would need to retrieve the data from COS (the remote tier). Querying POOL_COL_P_READS and POOL_ASYNC_COL_READS gets the number of read requests made for that. Remember reading from remote storage is slow, and one would like these numbers to be as low as possible:
SELECT
POOL_COL_P_READS, POOL_ASYNC_COL_READS
FROM
TABLE (MON_GET_TABLESPACE('OBJSTORESPACE1',1))
POOL_COL_P_READS POOL_ASYNC_COL_READS
-------------------- --------------------
344 305
1 record(s) selected.
One can get the number of pages read from the Buffer Pool and the Caching Tier (sync and async) by querying POOL_COL_L_READS, POOL_COL_CACHING_TIER_L_READS and POOL_ASYNC_COL_CACHING_TIER_READS respectively:
SELECT
POOL_COL_L_READS, POOL_COL_CACHING_TIER_L_READS, POOL_ASYNC_COL_CACHING_TIER_READS
FROM
TABLE (MON_GET_TABLESPACE('OBJSTORESPACE1',1))
POOL_COL_L_READS POOL_COL_CACHING_TIER_L_READS POOL_ASYNC_COL_CACHING_TIER_READS
-------------------- ----------------------------- ---------------------------------
183383 82884 78069
1 record(s) selected.
And the time spent on these reads by querying the various time elements: POOL_CACHING_TIER_PAGE_READ_TIME and POOL_ASYNC_CACHING_TIER_READ_TIME for the Caching Tier:
SELECT
POOL_CACHING_TIER_PAGE_READ_TIME, POOL_ASYNC_CACHING_TIER_READ_TIME
FROM
TABLE (MON_GET_TABLESPACE('OBJSTORESPACE1',1))
POOL_CACHING_TIER_PAGE_READ_TIME POOL_ASYNC_CACHING_TIER_READ_TIME
-------------------------------- ---------------------------------
26611 237547
1 record(s) selected.
And POOL_READ_TIME and POOL_ASYNC_READ_TIME for COS (the remote tier):
SELECT
POOL_READ_TIME, POOL_ASYNC_READ_TIME
FROM
TABLE (MON_GET_TABLESPACE('OBJSTORESPACE1',1))
POOL_READ_TIME POOL_ASYNC_READ_TIME
-------------------- --------------------
285281 37319
1 record(s) selected.
One can also use the aforementioned equations to get the Buffer Pool and cache hit percentages:
SELECT
DECIMAL (100.0 *
(POOL_COL_LBP_PAGES_FOUND – POOL_ASYNC_COL_LBP_PAGES_FOUND)
/ (POOL_COL_L_READS + POOL_TEMP_COL_L_READS)
,5,2) AS BP_HIT_PCT
FROM
TABLE (MON_GET_TABLESPACE('OBJSTORESPACE1',1))
BP_HIT_PCT
----------
54.96
1 record(s) selected.
SELECT
DECIMAL (100.0 *
(POOL_COL_CACHING_TIER_PAGES_FOUND - POOL_ASYNC_COL_CACHING_TIER_PAGES_FOUND - POOL_TEMP_COL_CACHING_TIER_PAGES_FOUND)
/ (POOL_COL_CACHING_TIER_L_READS - POOL_ASYNC_COL_CACHING_TIER_READS + POOL_TEMP_COL_CACHING_TIER_L_READS),
5,2) AS CACHE_HIT_PCT
FROM
TABLE (MON_GET_TABLESPACE('OBJSTORESPACE1',1))
CACHE_HIT_PCT
-------------
99.19
1 record(s) selected.
Now if I reconnect to the database and re-run the same query, the data would have been placed in the Caching Tier. To check that, lets query the number of reads to the COS after running the query again.
SELECT
POOL_COL_P_READS, POOL_ASYNC_COL_READS
FROM
TABLE (MON_GET_TABLESPACE('OBJSTORESPACE1',1))
POOL_COL_P_READS POOL_ASYNC_COL_READS
-------------------- --------------------
0 0
1 record(s) selected.
Indeed, we didn’t retrieve anything from COS. But what about the Buffer Pool and the Caching Tier?
SELECT
POOL_COL_L_READS, POOL_COL_CACHING_TIER_L_READS, POOL_ASYNC_COL_CACHING_TIER_READS
FROM
TABLE (MON_GET_TABLESPACE('OBJSTORESPACE1',1))
POOL_COL_L_READS POOL_COL_CACHING_TIER_L_READS POOL_ASYNC_COL_CACHING_TIER_READS
-------------------- ----------------------------- ---------------------------------
180093 82884 82418
1 record(s) selected.
The number of reads is similar to before, which is expected. But if we check the time spent on reading from the Caching Tier, we will see that it’s much faster now because all the bandwidth of the cache is utilized for serving data to our query.
SELECT
POOL_CACHING_TIER_PAGE_READ_TIME, POOL_ASYNC_CACHING_TIER_READ_TIME
FROM
TABLE (MON_GET_TABLESPACE('OBJSTORESPACE1',1))
POOL_CACHING_TIER_PAGE_READ_TIME POOL_ASYNC_CACHING_TIER_READ_TIME
-------------------------------- ---------------------------------
317 22360
1 record(s) selected.
And with everything found in the cache, there is no surprise the cache hit percentage was 100%.
SELECT
DECIMAL (100.0 *
(POOL_COL_CACHING_TIER_PAGES_FOUND - POOL_ASYNC_COL_CACHING_TIER_PAGES_FOUND - POOL_TEMP_COL_CACHING_TIER_PAGES_FOUND)
/ (POOL_COL_CACHING_TIER_L_READS - POOL_ASYNC_COL_CACHING_TIER_READS + POOL_TEMP_COL_CACHING_TIER_L_READS),
5,2) AS CACHE_HIT_PCT
FROM
TABLE (MON_GET_TABLESPACE('OBJSTORESPACE1',1))
CACHE_HIT_PCT
-------------
100.00
1 record(s) selected.
Let’s take a look at another example. Here I have a workload consisted of 10 clients each inserted 50,000 rows repeatedly for one minute. After the workload finished, one can query the monitoring elements CACHING_TIER_WRITE_REQS, REMOTE_TIER_WRITE_REQS, LOCAL_TIER_WRITE_REQS and COMPACTION_WRITE_REQS for the number of write requests performed on the Caching Tier, the Remote Tier (COS), the Local Tier (for Write-Ahead-Log) and the number of write requests performed on COS for compaction operation respectively.
SELECT
CACHING_TIER_WRITE_REQS, REMOTE_TIER_WRITE_REQS, LOCAL_TIER_WRITE_REQS, COMPACTION_WRITE_REQS
FROM
TABLE (MON_GET_TABLESPACE('OBJSTORESPACE1',1))
CACHING_TIER_WRITE_REQS REMOTE_TIER_WRITE_REQS LOCAL_TIER_WRITE_REQS COMPACTION_WRITE_REQS
----------------------- ---------------------- --------------------- ---------------------
8942 91 24348 37
1 record(s) selected.
And one can get the size of data written by querying their corresponding BYTES elements, like this:
SELECT
CACHING_TIER_WRITE_BYTES, REMOTE_TIER_WRITE_BYTES, LOCAL_TIER_WRITE_BYTES, COMPACTION_WRITE_BYTES
FROM
TABLE (MON_GET_TABLESPACE('OBJSTORESPACE1',1))
CACHING_TIER_WRITE_BYTES REMOTE_TIER_WRITE_BYTES LOCAL_TIER_WRITE_BYTES COMPACTION_WRITE_BYTES
------------------------ ----------------------- ---------------------- ----------------------
1167952384 577213707 708670118 590708169
1 record(s) selected.
And the time spent (in millisecond) on writing the data by querying their corresponding TIME elements:
SELECT
CACHING_TIER_WRITE_TIME, REMOTE_TIER_WRITE_TIME, LOCAL_TIER_WRITE_TIME, COMPACTION_WRITE_TIME
FROM
TABLE (MON_GET_TABLESPACE('OBJSTORESPACE1',1))
CACHING_TIER_WRITE_TIME REMOTE_TIER_WRITE_TIME LOCAL_TIER_WRITE_TIME COMPACTION_WRITE_TIME
----------------------- ---------------------- --------------------- ---------------------
1970 12718 5766 7250
1 record(s) selected.
db2mon scripts
db2mon is a set of scripts built on top of Db2’s monitoring interface to monitor database activities. The new monitoring elements have been incorporated into db2mon to facilitate the monitoring and troubleshooting of performance problem with Remote Table Spaces.
The latest version of db2mon can be found here.
The Caching Tier (backed by NVMe drives) is a crucial component for good performance when using Remote Table Spaces. Ideally, we would like to give it as much space as possible. The size of the NVMe cache in a Db2 Warehouse on Cloud environment is dependent on the T-Shirt size and scale factor. In user managed environments, this size can be configured at deployment time through the Db2uInstance CR, as described in the documentation.
Now let’s use db2mon to look at the changes a bigger cache could make to a workload.
In this example, I have run the DB Insights workload and collected db2mon reports. At first my cache is quite small, only 25GB per MLN. From the report I can see the workload is spending a high percentage of wait time on reading from COS (PCT_POOL_R) and from the Caching Tier (PCT_CACHET_SYNC_R).
Cache Size = 25GB/MLN:
 |
So, I increased the cache to 250GB and rerun, and saw a big improvement right away. The percentage of wait time spent on reading from COS drop from about 14% to about 1%, and that for reading from the Caching Tier drop from about 2.7% to less than 1%.
Cache Size = 250GB/MLN:
From the db2mon reports, I can also see the number of reads from the remote storage (POOL_COL_P_READS) and the amount of time spent (POOL_READ_TIME) was reduced significantly by 75%.
Cache Size = 25GB/MLN
Cache Size = 250GB/MLN:
Conclusion
Db2 introduced a two-tier caching system to support Remote Table Spaces, also known as Native Cloud Object Storage table spaces. Cloud Object Storage provides a low cost, high bandwidth but also high latency storage solution on the cloud. To overcome the high latency and to improve the access and storage efficiency of the Cloud Object Storage, a Caching Tier backed by NVMe drives was added.
In this blog post, we provided a high-level overview of how the new Caching Tier works, some new operations that take place behind the scenes to automatically optimize the data layout and clustering, and the new elements added to the monitoring table functions to monitor their activities. We have also looked at db2mon, a tool that helps users monitor and diagnose performance issue when using Remote Table Spaces. With these new and updated facilities, users of traditional table spaces in block storage should feel right at home with Remote Table Spaces in Cloud Object Storage.
Other References
Here are some blogs and presentations with more information about Remote Table Spaces that I found very useful:
- Db2 Cloud Object Storage Architecture and Performance Considerations
- Why is Db2 Warehouse faster with Cloud Object Storage?
- Why is Ingest into Db2 Warehouse faster with Cloud Object Storage?
About The Author
Steven Luk joined the Db2 Performance team in 2000. Since joining the team, Steven has worked on numerous Db2 offerings and features including BLU Acceleration, Next Generation Insert for Columnar Tables, Logical Backup and Restore and Advanced Log Space Management. More recently he has been working on the Native Cloud Object Storage feature of Db2 Warehouse. Steven can be reached at ysluk@ca.ibm.com.